
The Senate of the United States shall be composed of two Senators from each State, elected by the people thereof, for six years; and each Senator shall have one vote. The electors in each State shall have the qualifications requisite for electors of the most numerous branch of the State legislatures.
— 17th amendment to u.s. Constitution, ratified april 8, 1913

The main issue and problem for what the 17th Amendment attempted to correct for Congress, specifically for the Senate, was that Article 1, Section 3, Clauses 1 and 2 of the 1787 Constitution dictated that each state legislature appointed its own two state Senators for an initial six-year term. Regardless of the state’s population size, each state was entitled to two senators with two “equal” votes in the federal Congress. This helped reassure anti-federalists of the time, and previously covered in Part 5 of this series, that an overly centralized power-base like the federal government would not devour state’s powers but instead provide an oversight to the House of Representatives whose members were elected by popular vote by their state’s citizens.
Across the aisle, opponents countered the anti-federalist argument that within such a circle of powerful state legislatures, there existed two primary problems: 1) legislative corruption influenced by monetary gains and interests, and 2) electoral deadlocks paralyzing necessary legislations for all the people’s interests. And since the Amendments’ 1913 ratification another major problem now persists: no reelection term-limits for Senators (see Table below)—essentially an identical chronic problem today with Supreme Court Justices’ lifetime terms. Notice the lengths of service for these 25 Senators:
25 Longest Serving U.S. Senators To-Date*
| senators | dates of service | length of service |
|---|---|---|
| Robert C. Byrd (D-WV) | Jan 3, 1959–Jun 28, 2010 | 51 years, 5 months, 26 days |
| Daniel K. Inouye (D-HI) | Jan 3, 1963–Dec 17, 2012 | 49 years, 11 months, 15 days |
| Patrick J. Leahy (D-VT) | Jan 3, 1975–Jan 3, 2023 | 48 years |
| Strom Thurmond (D, R-SC) | Dec 14, 1954–Apr 4, 1956 and Nov 7, 1956–Jan 3, 2003 | 47 years, 5 months, 8 days |
| Edward M. Kennedy (D-MA) | Nov 7, 1962–Aug 25, 2009 | 46 years, 9 months, 19 days |
| Chuck Grassley (R-IA) | Jan 3, 1981-present | 42 years, 1 month, 7 days |
| Orrin G. Hatch (R-UT) | Jan 3, 1977–Jan 3, 2019 | 42 years |
| Carl T. Hayden (D-AZ) | Mar 4, 1927–Jan 3, 1969 | 41 years, 10 months |
| John C. Stennis (D-MS) | Nov 5, 1947–Jan 3, 1989 | 41 years, 1 month, 29 days |
| Ted Stevens (R-AK) | Dec 24, 1968–Jan 3, 2009 | 40 years, 10 days |
| Thad Cochran (R-MS) | Dec 27, 1978–Apr 1, 2018 | 39 years, 3 months, 6 days |
| Fritz Hollings (D-SC) | Nov 9, 1966–Jan 3, 2005 | 38 years, 1 month, 25 days |
| Mitch McConnell (R-KY) | Jan 3, 1985–present | 38 years, 1 month, 7 days |
| Richard B. Russell, Jr. (D-GA) | Jan 12, 1933–Jan 21, 1971 | 38 years, 10 days |
| Russell B. Long (D-LA) | Dec 31, 1948–Jan 3, 1987 | 38 years, 3 days |
| Francis E. Warren (R-WY) | Nov 18, 1890–Mar 3, 1893 and Mar 4, 1895-Nov 24, 1929 | 37 years, 4 days |
| James O. Eastland (D-MS) | Jun 30, 1941–Sep 28, 1941 and Jan 3, 1943–Dec 27, 1978 | 36 years, 2 months, 24 days |
| Warren G. Magnuson (D-WA) | Dec 14, 1944–Jan 3,1981 | 36 years, 20 days |
| Joe Biden (D-DE) | Jan 3, 1973–Jan 15, 2009 | 36 years, 13 days |
| Pete V. Domenici (R-NM) | Jan 3, 1973–Jan 3, 2009 | 36 years |
| Carl Levin (D-MI) | Jan 3, 1979–Jan 3, 2015 | 36 years |
| Richard G. Lugar (R-IN) | Jan 3, 1977–Jan 3, 2013 | 36 years |
| Claiborne Pell (D-RI) | Jan 3, 1961–Jan 3, 1997 | 36 years |
| Richard C. Shelby (R-AL) | Jan 3, 1987–Jan 3, 2023 | 36 years |
| Kenneth D. McKellar (D-TN) | Mar 4, 1917–Jan 3, 1953 | 35 years, 10 months |
As with the transgenerational power-hold Supreme Court Justices currently possess over the American people, the Senate and Senator votes today have an even more detrimental, anti-democratic effect than they did in 1788 to 1913. With modern and recent service-lengths averaging between 35–47 total years; about 45-years of one political (partisan?) ideology or covering about two generations of Americans. Consequentially, the U.S. Senate has become a major roadblock to effective, efficient, critical governing to protect the American people during times of economic and/or public safety and general health, even sometimes life or death, e.g. COVID-19. The Senate simply does not move fast enough for modern forms of crises management. Furthermore, the lethargic 21st-century Senatorial condition confers spurious political advantages to small tiny states, their senators, and their 18th-century Constitutional, economic-corporate and political dominance which is gifted in gratis by two equal votes regardless of state size.
During the 1787 Philadelphia Convention and the drafting of our Constitution, many of the Founders recognized what the Connecticut Compromise would do, at least over a period of time. They could not have been more correct. As the overall population of the U.S. has reached nearly 337-million today, it means the smaller, tinier states have gained more federal money and more authority in the Senate as well as more weight in the Electoral College over the last 235-years. Both James Madison and James Wilson ardently opposed the Connecticut Compromise, and Wilson specifically spelled out that ‘equal state Senate votes would mean that a minority of voters could block the will of the majority,’ or of the American people. And this is exactly what has happened in today’s Congress.
The twenty-eight smallest states of the Union today, representing 20% of the American population, have 56% of the votes in the Senate. This disparity and distortion over two centuries now is precisely why the increased voting strength between states with wealth and population versus those without and much smaller populations has occurred, and as a result, the majority receives less and less federal representation. This is also reflected in many state governments as well. With each passing decade the Constitution’s 18th-century “minoritarian” equal state-voting principle impacts national policies and allocation of funds more and more, too often at the expense of the greater American good.
A “New” Senate: Reflecting the Popular Will
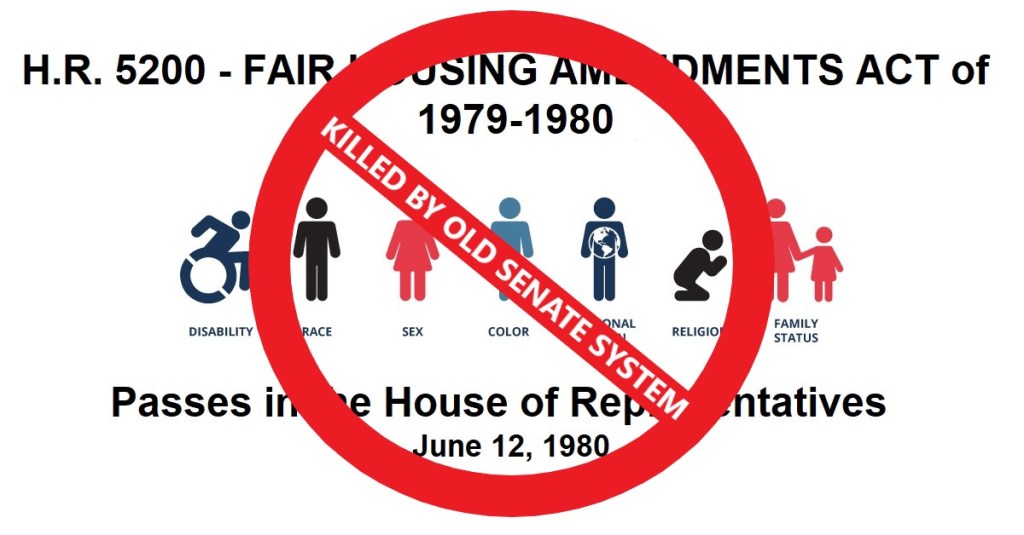
The better welfare of the greater national good and a more truer Republic democracy by a new Senate-voting system significantly outweighs the aforementioned flaws, disparity, and distortions of keeping the 18th-century system. If this New Senate were structured primarily on the state’s population, and to a lesser extent say the smaller-sized states’ X-quotient of wealth and resources toward the national well-being, surely this would offer a more equitable system assuring the overall national popular will was more realized. To demonstrate this reform, the following two slideshows illustrate just how a reimagined, past Senate voting would’ve substantially changed our last twenty-plus years of national policies, some of which our “Old Senate” system has had (very?) harmful consequences.


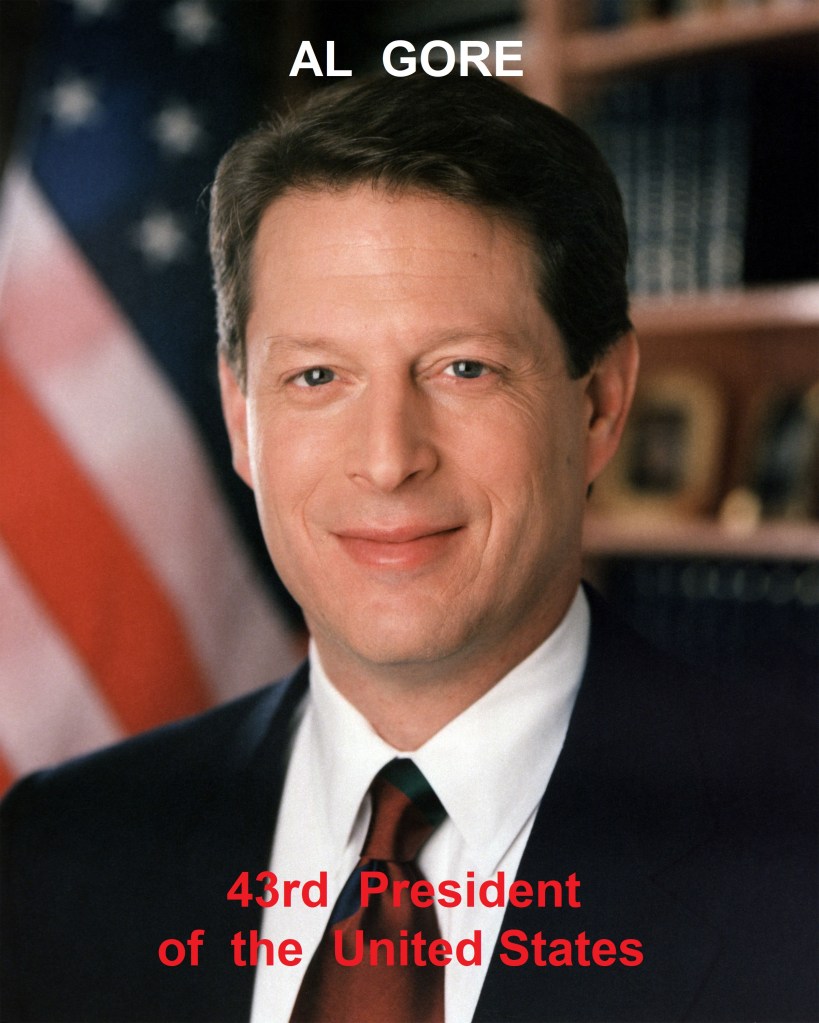

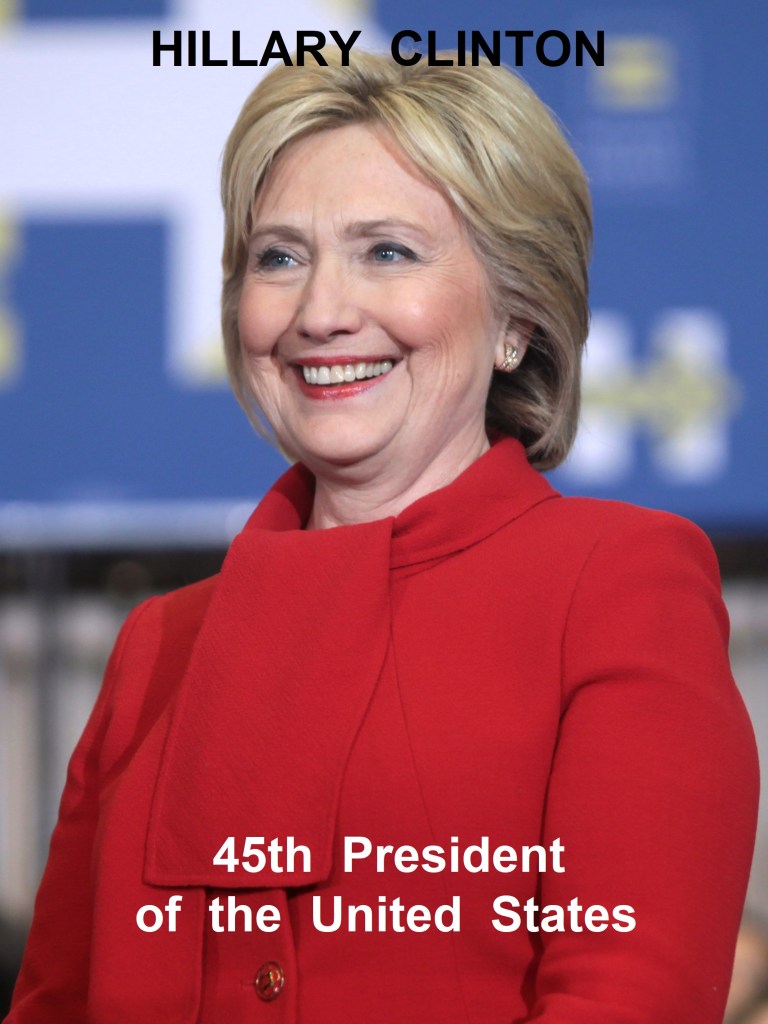


Moreover, several different variances in domestic and foreign policies (see following slides) would have certainly been enacted or rejected had a “New” 20th– or 21st-century Senate voting system been put in place in 1970:


Under the “New” Senate voting system, recently appointed and confirmed 53-year old Supreme Court Justice Brett Kavanaugh would have never been voted in. He would have lost by a sizable margin—approximately by 20% or more—by the twenty-two larger states (and Senators) that makeup about 80% of the American population. Justice Kavanaugh only received his confirmation because of the 28 smallest states and their (ultra) Conservative Senators’ votes. In a new Senate voting system reflective of Americans and their interests, Kavanaugh would’ve been easily rejected. To put it a different way, Judge Kavanaugh’s lifetime appointment to our highest court in the land—that will affect 2-4 generations of Americans—was accomplished purely by a fossilized relic of our 18th-century Constitution’s “equal state Senate voting rule.” No debate.
Proof the Electoral College is Undemocratic
In 2024 Americans will elect the next President and Vice-President using the antiquated Electoral College system created by the 18th-century mindsets held in the Constitution. By that system, all actual votes will be cast by “electors,” not the American people. This may come as a shock to some American voters. Despite their dismay, it is completely true; the U.S. is not a comprehensive democratic Republic.
The key justifications for the invention of our Electoral College imparted by Convention delegates in 1787 no longer exist today. One must remember the historical context of what the Philadelphia delegates were negotiating and fiercely debating at the time. Many of those delegates felt average American voters would not sufficiently know the candidates governing experience, educational level obtained, and much less their personal backgrounds. These conditions were further exacerbated by transportation and communication limitations for most all American voters, thus making well-informed decisions difficult at best. That scared the Ba-jebus out of nearly everyone of them—they could not risk a narcissistic demagogue President or administration getting naïvely elected, then worse become a tyrannical king or American Caligula/Caesar. Thus, the Electoral College was created for an 18th-century nationwide citizen-conundrum.
None of these problems exist today, nor is the modern Originalist argument for the Constitution’s (divine?) integrity a persuasive argument against a purely popular vote by the people. And here is the most damaging function of today’s Electoral College: the Underrepresentation of States and their Electors. (see following Table)
| state | population 2023 | % of total population | electoral now | proportionate electoral | disc |
|---|---|---|---|---|---|
| 1. California | 40,223,504 | 11.92% | 54 | 64 | -10 |
| 2. Texas | 30,345,480 | 8.99% | 40 | 48 | -8 |
| 3. Florida | 22,359,250 | 6.62% | 30 | 36 | -6 |
| 4. New York | 20,448,194 | 6.06% | 28 | 33 | -5 |
| 5. Pennsylvania | 13,092,796 | 3.88% | 19 | 21 | -2 |
| 6. Illinois | 12,807,072 | 3.79% | 19 | 20 | -1 |
| 7. Ohio | 11,878,330 | 3.52% | 17 | 19 | +2 |
| 8. Georgia | 11,019,186 | 3.26% | 16 | 17 | +1 |
| 9. N. Carolina | 10,710,558 | 3.17% | 16 | 17 | +1 |
| 10. Michigan | 10,135,438 | 3.00% | 15 | 16 | +1 |
| 11. New Jersey | 9,438,124 | 2.80% | 14 | 15 | +1 |
| 12. Virginia | 8,820,504 | 2.61% | 13 | 14 | -1 |
| 13. Washington | 7,999,503 | 2.37% | 12 | 13 | -1 |
| 14. Arizona | 7,379,346 | 2.19% | 11 | 12 | -1 |
| 15. Massachusetts | 7,174,604 | 2.13% | 11 | 11 | 0 |
| 16. Tennessee | 7,080,262 | 2.10% | 11 | 11 | 0 |
| 17. Indiana | 6,876,047 | 2.04% | 11 | 11 | 0 |
| 18. Maryland | 6,298,325 | 1.87% | 11 | 10 | +1 |
| 19. Missouri | 6,204,710 | 1.84% | 10 | 10 | 0 |
| 20. Colorado | 5,997,070 | 1.78% | 10 | 10 | 0 |
| 21. Wisconsin | 5,955,737 | 1.76% | 10 | 9 | +1 |
| 22. Minnesota | 5,827,265 | 1.73% | 10 | 9 | +1 |
| 23. S. Carolina | 5,266,343 | 1.56% | 9 | 8 | +1 |
| 24. Alabama | 5,097,641 | 1.51% | 9 | 8 | +1 |
| 25. Louisiana | 4,695,071 | 1.39% | 8 | 7 | +1 |
| 26. Kentucky | 4,555,777 | 1.35% | 8 | 7 | +1 |
| 27. Oregon | 4,359,110 | 1.29% | 8 | 7 | +1 |
| 28. Oklahoma | 4,021,753 | 1.19% | 7 | 6 | +1 |
| 29. Connecticut | 3,615,499 | 1.07% | 7 | 6 | +1 |
| 30. Utah | 3,423,935 | 1.01% | 6 | 5 | +1 |
| 31. Iowa | 3,233,572 | 0.96% | 6 | 5 | +1 |
| 32. Nevada | 3,225,832 | 0.96% | 6 | 5 | +1 |
| 33. Arkansas | 3,040,207 | 0.90% | 6 | 5 | +1 |
| 34. Kansas | 2,963,308 | 0.88% | 6 | 5 | +1 |
| 35. Mississippi | 2,959,473 | 0.88% | 6 | 5 | +1 |
| 36. New Mexico | 2,135,024 | 0.63% | 5 | 3 | +2 |
| 37. Nebraska | 2,002,052 | 0.59% | 3 | 3 | 0 |
| 38. Idaho | 1,920,562 | 0.57% | 4 | 3 | +1 |
| 39. W. Virginia | 1,775,932 | 0.53% | 4 | 3 | +1 |
| 40. Hawaii | 1,483,762 | 0.44% | 4 | 2 | +2 |
| 41. New Hampshire | 1,395,847 | 0.41% | 4 | 2 | +2 |
| 42. Maine | 1,372,559 | 0.41% | 2 | 2 | 0 |
| 43. Montana | 1,112,668 | 0.33% | 4 | 2 | +2 |
| 44. Rhode Island | 1,110,822 | 0.33% | 4 | 2 | +2 |
| 45. Delaware | 1,017,551 | 0.30% | 3 | 1 | +2 |
| 46. S. Dakota | 908,414 | 0.27% | 3 | 1 | +2 |
| 47. N. Dakota | 811,044 | 0.24% | 3 | 1 | +2 |
| 48. Alaska | 740,339 | 0.22% | 3 | 1 | +2 |
| 50. D.C. | 715,891 | 0.21% | 3 | 1 | +2 |
| 51. Vermont | 647,156 | 0.19% | 3 | 1 | +2 |
| 52. Wyoming | 583,279 | 0.17% | 3 | 1 | +2 |
Reviewing the Table above, did you note how many states are under-represented and how many are (grossly) over-represented? Nine (9) states are (very?) under-representative of their people’s votes, and thirty-five (35) states are (very?) over-representative of fewer people’s votes! Even worse, those nine under-represented states are this nation’s most populous states, with real people, yet unreal Electoral votes! In a sense, the twelve (12) overly-represented states are/have been ghosting, or inventing unreal Electoral votes since at least 1960 and the Twenty-third Amendment.
Finally, the Electoral College promotes harmful, sometimes disastrously dueling, hyper-divisive politics or duopoly partisanship between the two major parties. This deadens civic-political discourse and impedes policy reforms and/or creation as we’ve seen over the last 2-3 decades with the chasm widening more and more every four-to-eight years. If that persists, it will be catastrophic for this country as well as democracy as a whole around the world.
∼ ∼ ∼ § ∼ ∼ ∼
In the Conclusion of this 7-part series, I want to cover more extensively Gerrymandering and the 2019 Supreme Court decision Rucho v. Common Cause and how that ruling has had very adverse affects on our Republic democracy and today badly distorts election outcomes. I will also get into HOW we must approach and construct a proportional representation system that actually DOES reflect a true democracy.
I hope those who are still following this series will find it helpful for your own civic benefits for yourself, your state, and our country. Thank you again everyone for your patience with me and my often slow writing and posting. Please feel free to leave your thoughts and comments below.
Live Well – Love Much – Laugh Often – Learn Always

The Professor’s Convatorium © 2023 by Professor Taboo is licensed under CC BY-NC-ND 4.0

Pingback: Part 5: A New U.S. Constitution | The Professor's Convatorium
Pingback: Conclusion: A New U.S. Constitution | The Professor's Convatorium