Games of Unknowledging – Part I

•••••

“The greatest enemy of knowledge is not ignorance,
it is the illusion of knowledge.”
— Stephen Hawking

(paragraph break)

How much do we know? How much do we not know? How much or how little should we know or shouldn’t know? Why do we either know it or don’t know it? What creates ignorance, keeps it alive, hidden, distorted, or used for political-military purposes?

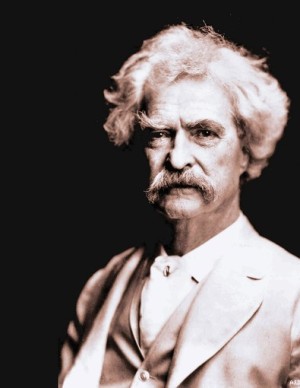
Agnotology, according to Wikipedia, is a recent new field of study about culturally induced ignorance or doubt. Renown cosmologist and theoretical physicist Stephen Hawking (above) sums up our task well. In our current age of technological devices and data, the internet (particularly social media) and the speedy access to and dissemination of information, as well as the instability or unavailability of quality broader education, it has become more paramount than ever before in human history for us to recognize, grapple, dissect, and understand exactly what state, who for, and how well knowledge and ignorance coexist or are imbalanced, and if it is significant or insignificant and why.
(line break)

∞ ∞ § ∞ ∞

Ignorance is generated in many various forms. Naivety, neglect or apathy, myopia, secrecy, disinformation, extinction, censorship or suppression, faith, and forgetfulness. They are all sources and surrogates of ignorance. By it’s very definition it permeates many recognized and unrecognized domains. Writing about women’s rights and their social issues past and present, Penn State University’s Dr. Nancy Tuana says:

“…it is important that our epistemologies not limit attention simply to what is known or believed to be known. If we are to fully understand the complex practices of knowledge production and the variety of features that account for why something is known, we must also understand the practices that account for not knowing, that is, for our lack of knowledge about a phenomena or, in some cases, an account of the practices that resulted in a group unlearning what was once a realm of knowledge. In other words, those who would strive to understand how we know must also develop epistemologies of ignorance.”

Dr. Tuana has several poignant scholarly publications about the epistemology of ignorance, especially regarding women’s treatment throughout human history. I will be diving into and swimming in her research and philosophies later in Part II of this series.

Perhaps for now it is best to start with general taxonomies of ignorance (the horse) before diving into the depths of the key agents of modern ignorance I personally want to cover in later parts (the cart).

General Classifications of Ignorance

Native or Innocent State is the first class and it defines ignorance that is a deficit to overcome, or something to grow out of, as a naive child would eventually learn that getting 8-hours of sleep per day is actually beneficial in the long-term, or that lying necessarily leads to more lying.

Time and Mental Constraints is the next class. We cannot possibly study and understand all things. We must leave some alone, select what subjects deserve our needs and attention. As a result, this form of ignorance is a product of inattention and can be lost for a period of time or forever.

Moral-Exemplary Caution is the third class and it includes ignorance for the sake of survival, protections, or mental, physical, and emotional stability. For example, jurors in court for a criminal case are strongly urged to remain ignorant (unbiased) to publicized facts, rumors, opinions, or news stories about their case. The various cinema movie-ratings by the Motion Picture Association of America currently have five designations for films suited to particular age groups. Which uranium and plutonium combinations are highly classified so as not to fall into the wrong unethical hands. And certain forms of torture on prisoners have specific classifications.

Strategic Subterfuge is the last classification of ignorance and the hardest to detect in real-time. Two prime examples of strategic subterfuge would be the World War II Allied Manhattan Project from 1942-46 and Operation Fortitude/Bodyguard in 1943-44, both highly successful webs of deception that shortened the war with Germany and Japan.

There are times and conditions that do warrant ignorance — it is not always bad. And yet, these four classes of ignorance give rise to other important questions. For instance:  Are there other sorts of events/conditions that ignorance creates which we might be unaware? When and how does knowledge create ignorance? What other forms of resistance, tradition, inattention, apathy, calculation, or distraction creates more ignorance? When does ignorance generate confidence, timidity, or arrogance, even megalomania? Because of ignorance what patterns of competence or disability are thereby brought into existence?

I hope to answer some of these questions, but I will also leave it to you my readers to answer some yourselves.

Bias and Concealment

One of the most catastrophic probabilities facing humanity is climate change. In few other global crises has there been more profound, proliferated bias and concealment than on climate change.

They are the world’s most distinguished minds of geophysics, meteorology, atmospheric science, geography, and other disciplines and they comprise the IPCC. Their studies and publications encompass the work of over 800 scientists and over 1,000 peer-reviewers from 130 nations around the world. Inside the U.S. the American Geophysical Union, the American Meteorological Society, and the American Association for the Advancement of Science have all ratified their findings. Abroad, the National Academies of Sciences in Brazil, Canada, China, France, Germany, Italy, Japan, Russia and three others also verified and confirmed the IPCC’s findings. See consensus image below.

IPCC Abstract

Despite the fact that worldwide theory, evidence, and consensus support the claim that anthropogenic global warming is underway, there is a remarkably high number of doubters, particularly in the U.S., that believe these reports are inaccurate, acts of worldwide(?) political-economic conspiracy, or completely fabricated. How is this possible? Six reasons, says Erik M. Conway and Naomi Oreskes.

The Six Main Cold War Contenders

It could be convincingly argued that there are only two or three main contenders against climate change science, but Conway and Oreskes reveal all major contenders and their interconnected allies during the Cold War, an era of mega-business and even bigger deep-pocketed business moguls. Would you consider these six listed below having direct and indirect mutual interests?

The George C. Marshall Institute — was founded by Robert Jastrow, Frederick Seitz, and William Nierenberg. The institute’s influence and popularity on post-war policy, Congress, and public opinion cannot be overstated. It was originally formed to streamline national security and defense policies in the Cold War against the Soviet Union. Its public mission statement at the time was “to encourage the use of sound science in making public policy about important issues for which science and technology are major considerations.” However, after the end of the Cold War the institute turned its attention to environmental issues receiving major funding from oil and gas corporations like Exxon-Mobil, at least $715,000 between 1998 and 2008. In 2001 after only 5-months as executive director, Matthew B. Crawford resigned explaining “[the Institute] is fonder of some facts than others.

SDI_TimeMagazine
April 1983 issue

Robert Jastrow — a planetary physicist and lead scientist with NASA, Jastrow, along with Seitz, Nierenberg, and Siegfried Fred Singer, together headed all major skepticism to climate change and other health and environmental crises between 1982 to the 2000’s. How these four scientists are closely connected will be covered below.

Strategic Defense Initiative (SDI) — SDI was a proposed missle-defense “shield” with orbiting space-lasers presented in March 1983 by President Ronald Reagan. When 6,500 academic scientists unionized to not accept or solicit any government funds for the program, Robert Jastrow was so furious that he rallied several well-known scientists of specific fields within the Defense Department and the military-scientific community to combat SDI opposition via the George C. Marshall Institute. He would also accuse the Union of Concerned Scientists, a big challenger to SDI, of being agents for Mikhail Gorbachev and the Soviets.

Big Tobacco — Fortune 100 tobacco corporations like R.J. Reynolds Tobacco Company (aka Nabisco Group Holdings) spent $45-million between 1979 and 1989 toward finding and publishing evidence or arguments casting doubts about cancer, heart disease, and other smoking-related adverse effects, cases and deaths with their supporting research and publications. The principle advisor for these doubt-publications:  the aforementioned Frederick Seitz.

Acid Rain — is contaminated rainfall from sulfate emissions from power-plants and nitrous emissions from auto exhausts. In 1970, 1977, and 1990 emission standards legislation addressed and updated this growing atmospheric contaminants begun by the Clean Air Act of 1963. Just these measures, from the already established scientific studies and results, took as they say, acts of Congress, over a 50-year period to be adopted! Oh, and the aforementioned S. Fred Singer and Reagan’s White House stalled reports from OSTP, the Office of Science and Technology Acid Rain Panel in which Singer served.

Chlorinated Fluorocarbons (CFCs) — sulfate emissions and nitrous emissions soon lead to higher public awareness of refrigerators, AC units, hair spray, and other various stratospheric contaminants which deplete the ozone layer, known as CFC’s. In 1995 Sherwood Rowland, Mario Molina, and Paul Crutzen won Nobel Prizes for their contributions in Chemistry identifying the damaging effects of CFC’s to the ozone layer. The twice aforementioned S. Fred Singer argued against these men and afterwards even to Congress opposing their findings!

The Impact of These Tactics

During the 1992 mid-term elections, Republican pollster and media advisor Frank Luntz sent out a memo instructing federal Republican candidates to implement the political counter-strategy of scientific uncertainty:

“The scientific debate remains open.

…you need to continue to make the lack of scientific certainty a primary issue in the debate.”
“The Luntz Research Companies – Straight Talk”, p. 137, http://www2.bc.edu/~plater/Newpublicsite06/suppmats/02.6.pdf – See also Mooney, The Republican War

A 2007 Gallup poll showed that 60% of Americans believed global warming was happening, which meant too that 40% felt there was still “a lot of disagreement among scientists.” Yet, in fact by 1979 — 28-years earlier! — scientists around the globe were increasingly unanimous that what Charles David Keeling had proven about rising CO² in the 1960’s was increasing more in the ’70s. Surveys of the scientific literature worldwide from 1965 to 1979 found only 7 articles predicting cooling and 44 predicting warming. What is also strangely peculiar is that the bulk of the scientific work was done in the U.S. As of March 2016 little has changed in the public eye at only 64% believing it is happening. Why the snail’s pace? No surprise, it isn’t a quick easy answer, but there are two major contributing factors:  1) the IPCC with the Kyoto Treaty (and Doha Treaty) and 2) the Republican-held U.S. Senate ten out of the twelve relevant years concerning the 1997 Byrd-Hagel Resolution (S. Res. 98).

US_Senate_floor

Since 1990 the Intergovernmental Panel on Climate Change (IPCC) along with the World Meteorological Organization (WMO) and their scientists from 191 member nations and territories, found irrefutable cumulative evidence of global warming. In 1997 a protocol for fighting global warming and reducing greenhouse gas concentrations, the Kyoto Protocol, was adopted in Kyoto, Japan based on the consensus of these scientists around the world and how to reduce and reverse the effects of human-sourced causes. Sadly, the U.S. Senate voted on July 25, 1997 (95 to 0) rejecting this protocol if it did not impose firm emissions limits on the developing nations like India or the People’s Republic of China, both major sources of carbon dioxide emissions along with the United States. This S. Resolution 98 effectively shut-down the Kyoto Treaty before President Clinton could have an opportunity to push for ratification. As of today, the U.S. is the only major industrialized nation refusing participation in the Kyoto and Doha agreements.

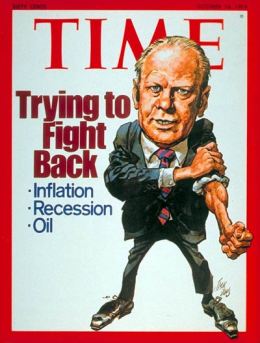
After many articles in Business Investor’s Weekly, Forbes Magazine, and The Wall Street Journal S. Fred Singer continually challenged the work of these scientists around the world including those winning the Nobel Prize, others did so as well, mimicking Singer such as political scientist Bjørn Lomborg. Four renown scientists countered Singer and Lomborg with their publication “Misleading Math About the Earth” in January 2002. John Bongaarts, John Holdren, Thomas Lovejoy, and Stephen Schneider demonstrated that the majority of Lomborg’s citations were not from reputable scientific sources, but media-entertainment articles and non-scientific publications. But the damage and impact of the media onslaught had been done. Time Magazine named Lomborg one of the most influential thinkers of 2004.

The Cold War “old guard,” the market fundamentalists, the paranoid contrarians like Singer, Jastrow, Seitz, and Nierenberg saw any challenge or questioning of America’s proud free-market system as anti-capitalist, pro-communist, pro-socialist, and pro-regulatory on suffocating scales! Thus, without the broader information of evidence, data, and pure science from all points, favorable and oppositional, too many doubts were biasedly cast about the science and scientists. Capitalism triumphed over Soviet communism, but now it has to rectify its own excessive waste and impact on the ecosystems. Leave it to the mega-corporations of the world and it goes unchanged and buried. Though unfettered sourcing of our planet’s fossil-fuels was our “free lunch,” our Industrial Revolution, and our two World Wars, followed by the prosperity of the 1950’s, 60’s and 70’s, global warming is now the rising bankrupting unreckoned invoice. The accumulated interest, charges, and principle-balance could have and should have been confronted and corrected during the last 50+ years. Instead, warehouses of well-funded doubt and unknowledging were produced in its place.

∞ ∞ § ∞ ∞

In Part II of Games of Unknowledging, I will delve into the widely used, but less known exercises of Manufactured Uncertainty, some Women’s Rights and Equality (or non-rights and inequality), and the lost worlds and knowledge of Abortifacients. I do hope you’ll return for it.

Live Well — Love Much — Laugh Often — Learn Always

(paragraph break)

Creative Commons License
Blog content with this logo by Professor Taboo is licensed under a Creative Commons Attribution-NonCommercial 4.0 International License.
Permissions beyond the scope of this license may be available at https://professortaboo.com/contact-me/.

A Collective Imperative

(paragraph break)

If a free society cannot help the many that are poor,
it cannot save the few who are
rich.
— John F. Kennedy

(paragraph break)

[This is the fourth and final segment of a series continuing from part 3 – Unveiling Incentive-Opportunity Fallacies] (paragraph separation)

(paragraph break)

* * * * * * * * * *

What is excessiveness?  The dictionary defines it this way:  exceeding a normal, usual, reasonable, or proper limit.  Historians have sometimes defined it as out Herod Herod.  Lord Salisbury in Shakespeare’s King John perhaps described it better as painting the lily:

Therefore, to be possess’d with double pomp,
To guard a title that was rich before,
To gild refined gold, to paint the lily,
To throw a perfume on the violet,
To smooth the ice, or add another hue
Unto the rainbow, or with taper-light
To seek the beauteous eye of heaven to garnish,
Is wasteful, and ridiculous excess.

Every single human being requires a handful of necessities:  water, food, climate-control, and shelter.  To what extent or elaboration those four basic needs are fulfilled, can be averaged at any location, and thus a global standard can be determined.  One and perhaps a minimum of two of these basic life-needs are in finite supply and crisis on our planet.

Fair warning for those who are sensitive to or bothered by grim facts of nature, our planet, and other human groups, self-discretion should be considered.  What follows, in my opinion, needs to be at least made aware and considered by everyone on Earth.

(paragraph break)

* * * * * * * * * *

What do you think would happen if when you turned open your faucet and nothing came out?  How long could you survive without water?  Now, what do you think would happen if your entire city was without water or operating sewage?  What would happen if a nation lost its water and sewage?  There is no water to feed crops or gardens; no clean water to drink.  Are you getting the picture?  If not, let’s hear the alarming projections some scientists, scholars, and professional experts are reporting.  Sorry this alarming documentary is an hour-and-a-half long, but it needs to be shared:

If you still feel this is not a problem for you and your children and grandchildren, you should have your ears examined.  If you feel resource conservation is a form of socialism or communism, then you are in delusional denial.

Excessive opulence or resource hoarding is no different a global footprint than spending or consuming recklessly; they both accomplish the same singularity:  proportionate risk.  The more excessive, the more risk; the more risk, the more excessiveness to avoid it.  As a species, if not as Americans, we need to…no, we must greatly refine our life-ambitions and the education of those ambitions and their purpose.

But let’s pause a moment and analyze where most Americans have headed since 1870 and are currently heading.

1870 – 1900:  The Gilded Age

Mark Twain

Mark Twain

Much pride and boasting has been made of America’s age of industrialization, that it was the catalyst that put the nation in the same discussion of the world’s greatest empires.  Yet of our nation’s 12-million families then, 11-million earned less than $1,200 per year; of this group the average annual income was $380, well below the poverty line.  In today’s CPI dollars (the purchasing power of goods and services produced in the 1890 economy) that is $9,890 per year per household.  In his book The Gilded Age: A Tale of Today, Mark Twain wrote of the day’s barons and tycoons, What is the chief end of man?—to get rich.  In what way?—dishonestly if we can; honestly if we must.

Though pre-1920 U.S. economic reports are less comprehensive as post-1920, Benjamin Schwarz of the World Policy Institute and Executive Editor of World Policy Journal writes in his 1995 New York Times article By 1890, the richest 12-percent of households owned about 86-percent of the country’s wealth.

1890 – 1920:  Progressive Era

The Roaring Twenties

The Roaring Twenties

In 1910 the average annual household income was $574 per year.  In today’s CPI dollars that is $14,300 per year per household.  During this era America’s top 1-percent owned about 40-50 percent of the nation’s wealth and the top 10-percent fluctuated around 70-percent until President Theodore Roosevelt began his anti-trust legislation and wealth redistribution via progressive taxation.

1920 – 1929:  The Roaring Twenties

The average annual household income was $1,407 per year in 1920.  In today’s CPI dollars that is $16,100 per year per household.  In 1922 America’s top 1-percent owned 37% of the nation’s wealth; a slight change in years following Teddy Roosevelt’s administration.  America’s middle-class indeed experienced a relative age of prosperity during the Roaring Twenties due to the automobile industry which fed industries such as oil, road-construction, tourism, manufacturing, and electric-power.

1929 – 1941:  The Great Depression

the-great-depressionThe average annual household income in 1930 was $1,388.  By 1940 it had dropped to $1,315.  In today’s CPI dollars that is $19,100 and $21,500 per year per household respectively.  America’s top 1-percent in 1933 owned 33% of the nation’s wealth and 36.4% in 1939 demonstrated the upper-upper class comfortably rode out the stock market crash of ‘29.  Unemployment for the nation’s middle class was at 25% and especially higher in heavy industries such as lumbering and agricultural exports in cotton, wheat, and tobacco.  Fortunately, from a purely economic standpoint, another world war was on the horizon ready to put Americans, particularly women, back to work on a road to bigger prosperity than the Roaring Twenties.

1945 – 1973:  Postwar Prosperity – The Golden Era

The average annual household income was $3,180 in 1950 ($30,300 in 2012 CPI) and $4,816 in 1960 ($37,300 in 2012 CPI), a significant increase in just 10-years.  Middle-class Americans also enjoyed a bigger piece of the nation’s wealth:  70.2% in 1945 and 73% in 1949 while America’s top 1-percent saw their portion drop again to 29.8% and 27% respectively.  Yet, it is this Golden Era that firmly placed the United States as a world power and dominant economy.  As more and more Americans gained more wealth and more income, the nation experienced its most prolific prosperity to-date.  How it happened will be examined shortly.

The American Dream

The American Dream

When Dwight Eisenhower took office (1953-1961) the nation was going through another recession post-Korean War causing a decline in the nation’s GDP.  This resulted in middle-America having less of the nation’s wealth over a 16-year period down to 65%, while America’s top 1-percent relished in increases back up to 34.4% of the nation’s total wealth in 1965.

By 1970 the average annual household income was $7,494 or about $44,300 in today’s CPI dollars; another notable increase in 10-years.  As the Golden Era drew to a close and the Cold War and Vietnam festered, President Lyndon Johnson’s Great Society programs increased lower and middle-America’s wealth to 71% while America’s top 1-percent saw theirs fall to 29% of the nation’s wealth.  However, hard times were just around the corner for most Americans.

1970 – 1976:  Age of Stagflation

Image Time Warner

Image Time Warner

In 1973 the average annual household income was $9,037 or approximately $46,700 per household in today’s CPI dollars.  The nineteen-seventies became known economically as the Age of Stagflation.  The 25-year U.S. economic growth post-WW2 had stagnated to a crawl, and prices in goods and services rose annually in the double-digits from 10% in 1973 to 18% in 1979.  Due to poor performances on Wall Street, America’s top 1-percent saw their share of the nation’s wealth drop to the lowest in history:  19.9%.  Yet, middle-America enjoyed the highest ever share of the country’s wealth at 80%.

The eras of suburbanization in the 50’s and 60’s, however, had significant consequences in the 70’s.  The migration of tens of millions of middle-Americans (most of them White), moving to newly developing suburban towns meant getting to work in cities went from public transit to private vehicles.  This in turn caused America to become heavily dependent on foreign oil.  The long-term varied ripple effect of suburbanization cannot be overemphasized, one of which is our bigger footprint on environmental and global issues.

Wolff Table 1 Wealth

1976 – 1992:  Gilded Age Returns and Reaganomics

Reagan addresses Congress 1981 (Wikipedia)

Reagan addresses Congress 1981 (Wikipedia)

From 1976 to 1988 the average annual household income was $11,080 or about $44,700 in 2012 CPI dollars – yes, a $2,000 drop from the previous 3-years – to $25,167 or about $48,800 in 2012 CPI dollars; just above break-even from 1976.  To combat the stagflation of the 70’s, government deregulation along with personal and business tax cuts gained popularity.  As it turned out most of the tax breaks, along with deregulating helped America’s upper-classes.

Additionally, defeats of labor unions – unions made possible by Teddy Roosevelt reforms with long histories of keeping big-businesses from corruption and abuse of workers – also fattened the pockets of America’s top 1-percent by going from 19.9% ownership of the nation’s wealth to having 35.7% by 1989.  By 1992 the AAHI (average annual household income) was $28,870 or about $47,200 in 2012 CPI dollars; another drop from 1988.  While middle-America struggled, the top 1-percent in America owned a rising 37.2% of the nation’s total wealth.

Beginning in 1983 economist Edward Wolff has tracked America’s net wealth and financial (non-home) wealth distributions.  As Table 1 above and Figure 1 below show, it is an increasingly bleak outlook for the majority of Americans.

Figure 1 Net & Financial Dist

Click image for larger view

1990 – Present:  Globalization and World Superpower

The 1990’s will be compared to the prosperity of the 1920’s and the 1960’s.  But as a whole is that what the data reveals?  The AAHI was $32,558 in 1995 or about $49,000 in 2012 CPI dollars and America’s top 1-percent enjoyed another increase in the owned wealth of the nation at 38.5%.  For six brief years (1994-2000) the economy saw rises in the national debt, the stock market, and the GDP while inflation plateaued and unemployment dropped below 5% because of the Dot-com Boom.  Economist and civilians alike agree that the growth explosion was mostly a result of workplace computerization.  But the good times would come to an end in 2001.

Map of the world wide web

Map of the world wide web

A constant influx of immigrants seeking the American Dream, an American economy becoming one of the major players in a growing global economy, a false sense of security in the housing market, and numerous corporate scandals in the energy and finance sectors due to previous government deregulating, all contributed to the tipping-point by 2007.  The AAHI in 2000 was at $40,418 or $53,900 in 2012 CPI dollars and the top 1-percent in America saw their portion in the nation’s wealth drop to 33.4% due to a sharp declining stock market worsened by the attacks of 9/11.  There is another set of globalization dynamics that added to the plight of middle-America.

With the exodus of American jobs like cheaper electronics, fashion, shoes, and toys moving to developing nations, middle-Americans watched as their job and salary-leveraging also weakened with fewer lateral or upper employment positions.  Then jobs in TV, auto, steel, and home-furnishing manufacturing followed.  With those positions gone abroad, the American job-market went from high-paying management positions to simple service-industry low-paying positions which certainly need no college degree.  This move marked the boom of trade-school certifications for a growing electronic blue-collar job-market.

manufacturing_mexico

Why Mexico is becoming a global manufacturing power – Bloomberg Businessweek article

The domino-effect of American digitization, the snowballing Internet, and high-speed networks spreading to all corners of the globe have combined to gorge the growing socio-economic gap wider and deeper.  In 2007 the AAHI was $48,332 ($53,500 in 2012 CPI dollars) eaten-up by inflation and the cost-of-living.  Meanwhile, the top 1-percent owned a steady 34.6% of the nation’s wealth.  The lap of luxury doesn’t stop there.  With the creation of a connected more global economy today, along with new multiple global opportunities and substantially lower-wages to foreign workers, it should come as no surprise what sector of the American population currently enjoys the fruits-of-foreign-labor.

The World’s 200 Richest People(s):

The most industrialized developed countries in the world by population-size are in Europe according to the 2013 United Nations Human Development Report.  Of the top 10 nations with the highest Human Development Index (HDI), six of them are in Europe (see Report).  One might infer from that list then that many of the world’s wealthiest people reside in those countries or at least in Europe.  You would be wrong.

Of the 200 richest people in the world as of 2012, 61 of them (or 31%) are citizens of the United States.  What is perhaps unexpected is where the second richest group of people call home.  Of the next 139, 20 of them (or 10%) are Russian, ironically a former part of the old communist U.S.S.R.  The next 26 richest people come from Germany (13) and Brazil (13) at 7% and 6.5% respectively.  To see the world’s wealth and what portion of it is owned by the wealthiest 200, see the pie-chart below.  For the most current world ranking of the world’s wealthiest as ranked by Bloomberg click here.

Wealthiest 200 pie-chart

As the largest population of one of the most modern industrialized nations – currently 314 million and growing – the United States has the largest percentage of the population with the smallest percentage of the nation’s wealth.  Since 1983, as seen in Wolff’s two Tables above, it has decreased every single year.  To put this disparity succinctly, in terms of financial eggs-in-a-basket the top 1-percent own 35% of all privately held stock, 62.4% of all business equity, and 64.4% of financial securities in America.  Is it any wonder why middle-American taxpayers were held for ransom in 2008 to bailout our own mega-banks and financial firms, mega-auto companies, and integral government-sponsored entities?  The top 1 and 10-percent held the nation by the balls.  Sit down, it get’s more alarming.

largeextremeinequalitychartThe top 10-percent own 81% to 94% of all American bonds, trust funds, stocks, and business equity, and nearly 80% of all commercial real estate.  The real value of financial wealth is determined by control of income-producing assets; assets that can absorb recessions or devastating irreparable depressions.  Therefore, it is reasonable to conclude that 10% of Americans own the United States.  Talk about utter investment stupidity in placing the nation’s “eggs” in one or two baskets!  There is no way to sugar-coat it.  Perhaps Abraham Lincoln’s Gettysburg Address should be rewritten to reflect today’s socio-economic times:  Government of the 10-percent, by the 10-percent, for the 10-percent.

Land of the Few, Home of the Lavish

Listed at $190-million, Copper Beech Farm in Greenwich, Connecticut is the most expensive home in America.  Built in 1896 and previously owned by the Greenway family of U.S. Steel with Andrew Carnegie as well as timber tycoon John Rudey, it has over 13,000 square feet on 50 waterfront acres with spectacular views of Long Island Sound.  As a French Renaissance style home with 12 bedrooms, wine cellar, a 75-foot outdoor pool, a grass tennis court, a large formal arboretum, two greenhouses, and private apple orchard, accessible by a 1,800-foot private driveway.  Oh, and the property includes two offshore islands.

Copper Beech - Greenwich, CT

Copper Beech – Greenwich, CT

Copper Beech Farm is simply one home of over 100 homes priced above $10-million.  From 2005 through 2012 Greenwich, CT has been ranked as the best wealthiest place to live in the U.S., the “Biggest Earner” per household in the U.S., and #1 wealthiest residents per capita in the nation.  Many of the residents are Wall Street hedge fund managers, writes Nina Munk of Vanity Faire Magazine, and “of the $1.2 trillion currently invested worldwide, approximately one-tenth, or $120-billion, is now managed out of Greenwich alone, according to Hedge Fund Research, Inc.”  Munk also reports that four of the richest 400 Americans live in Greenwich and three of those are hedge fund managers.  One Greenwich real-estate broker reported these four residents will drop five to eight-million dollars without a second thought.  Some even a lot more.

Almost As Big as the Taj Mahal –
To judge by the number of swollen, over ambitious mansions rising from lots in Greenwich these days, you’d almost think we were back in the 1910’s and 20’s – except that this time round the lots are small, and the houses are almost on top of one another.  “Years ago, wealthy houses were hidden in the rear of properties after long driveways…and no one ever built to the maximum allowable square footage,” remarked Diane Fox, long time director of Greenwich’s Planning and Zoning Department, in an e-mail to me.  “Today all big houses want to be seen from the road.””

Munk’s article of Greenwich’s rich and lavish also mentions that one interior designer installed broadloom carpet at $74,000 for one bedroom, and drapes and curtains at $20,000 to $25,000 for one bedroom.  You read it right, one bedroom.

Why is this level of wealth and excessive opulence worth mentioning?

Because today American legislation, political campaigns, and economic policies resemble little of what they did six decades ago.  In 2010 the U.S. Supreme Court allowed American corporations, including those owned by the top 1 and 10-percent of the nation, the opportunity of donating vast financial resources for political candidates and their election campaigns; “resources” with millions of dollars beyond what any individual voters could organize.  Remember, 80 to 90 percent of Americans hold or own just 4.7% of the nation’s financial wealth.  The political phrase in the 1940’s and 50’s “one person, one vote” means today “one dollar, one vote.”  That 2010 decision sets the stage for a class of super-wealthy political campaigners to push (as if a majority of individual voters) their one-dimensional political-economic interests:  enhancing their profits and revenues.

A Communal America is Imperative

This four-part series has not been about political, economic, or social envy.  It seems the bottom 99% or 90% are for the most part not jealous of America’s gazillionaires or their social contributions and hard-earned incomes.  What this four-part series has been about though is political fairness, representation, and efficiency.  As discussed in part two Productive Inequality, rent-seeking moves wages and wealth from the bottom and middle classes to the top 10 and 1-percent while distorting the “free market” in favor of some and to the detriment of most.  More “efficient” policies of the market matter for a more equitable distribution of national wealth.  Improper policies (e.g. of the last 32-years) lead to a less efficient economy and a growing divide between socio-economic classes.

Strength in lots of Einsteins!

Strength in lots of Einsteins!

It is a fairly simple overall concept.  When our society is sufficiently (even abundantly) funded in infrastructure, education, research, and technology, these vital areas of a thriving economy offer hope and security to ordinary citizens.  The majority of Americans, the bottom 90%, will actually SEE and experience for themselves what the U.S. Constitution, the Statue of Liberty, and all other symbols of democracy, equality and fairness are really made of… not just “promised” or rhetorically talked about on TV.  Those principles would be available to a vast number in society in an efficient dynamic economy.  Even the top 1-percent would benefit when the capabilities of so many quality workers and citizens are not wasted but fully utilized.  It’s a concept of not just strength in numbers, but strength in well-educated, ingenious, motivated Einstein numbers!  There is a huge difference between the two.  The difference is not just inclusive, but very alien to exclusive.

In his superb book The Price of Inequality:  How Today’s Divided Society Endangers Our Future, Nobel Prize winner in economics Joseph Stiglitz gives a superbly educated agenda on exactly how American government and her 314-million citizens can avoid falling into the same death-trap history’s great empires and their leaders fell into.  If you would like to read an outline of his proposed extensive agenda, click here.

My own meek semi-educated ideas of how not to follow, for instance, the Roman Empire’s demise or the former Soviet Union’s, or the more recent countries of Egypt, Tunisia, and Syria… are this:

What is the reading on your/our Collective-Goodness-Gauge?  What is the health of your/our common welfare, our passion for civic responsibility and the well-being of the persons near us?

These are NOT just social questions!  More importantly they are political and economic questions too.  As the French political philosopher Alexis de Tocqueville noticed about the nature of American society in 1835, freedom (or individualism) can be a tricky balancing act within democracy.  Some “individualized” Americans independent of a majority often have the pragmatic realization that looking after the welfare of others is not only good for the soul, but is equally good for business and wealth.  Stiglitz elaborates on this truth wonderfully:

“The top 1 percent have the best houses, the best educations, the best doctors, and the best lifestyles, but there is one thing that money doesn’t seem to have bought:  an understanding that their fate is bound up with how the other 99 percent live.  Throughout history, this has been something that the top 1 percent eventually do learn.  Often, however, they learn it too late.”

Americans together

…no matter class or status

The Roman Empire, Egypt, Tunisia, and Syria are just four examples to what Stiglitz refers.  The former Soviet Union is an example of no individualism when no single “part” is allowed to reach its full brilliance and potential for the benefit of the whole; the other extreme.  Both ends of the economic-socio-political spectrum REQUIRE resource investments and management from every single citizen.  The stable “middle” if you will, has a steady balanced, efficient, fair, and equal flow of civic investment.  Any one mechanism cannot efficiently coexist without the other efficient mechanisms.  So…

If the United States wishes to return as one of the best symbols of freedom, liberty, democracy, and equality for all, then reaching that efficient balanced middle is an imperative collaborative, collective return to a well-managed, well-governed, wealth-balanced cause.

* * * * * * * * * *

Further information —

Inside Job

(paragraph break)

(paragraph break)

Creative Commons License This work by Professor Taboo is licensed under a Creative Commons Attribution-NoDerivs 3.0 Unported License. Permissions beyond the scope of this license may be available at https://professortaboo.wordpress.com.