This will be a news story told the next several days a thousand times, praised a hundred different ways, and likely gone viral on social media. This last Tuesday in Decatur, Georgia a simple office clerk at an elementary school, full of students, treated a psychologically unstable gunman as a human being and averted a potentially bloody all too familiar school massacre. The risks that Antoinette Tuff had put herself can only be described as temporarily super-human — the right person, with the right background, in the right place at the right time — possibly saving many more young innocent lives.
If you haven’t yet listened or watched the news footage on all major networks, then do it. It is well worth the time. Here’s the CNN link: click here.
This story and lady hits a very personal nerve and flashback with me. I have been in (and in some ways am still in today) practically the exact same situation Ms. Tuff found herself. My personal story with a mentally unstable gunman can be read here: What Was I Thinking?
I am also an elementary-middle school teacher. I am a brother to a psychiatric sister who often either gets off her psych-meds or is forced off her psych-meds due to clinical restrictions, bureaucratic tape or “economic policy.” Our local state hospital and nearby meds-clinic just recently had a woman refused her psych prescriptions (reasons unknown to me) then left the clinic emotionally distraught in her car and crashed it 3-blocks away, killing herself and injuring others at the four-way red-light intersection. I am also a former 3 1/2 year employee of a Psych-A&D hospital’s Intake Office or Crisis Center/Office. I do indeed have personal experience with many situations like Ms. Tuff experienced, including her own divorce — for me two divorces — and thoughts of suicide by her self and her gunman; although in my personal experience the suicide was accomplished.
So watching and listening to Ms. Tuff’s situation and 911 call, choked me up and touched a sensitive emotional nerve with me…to put it mildly.
I have three points or questions I want to present to my readers and followers:
Did Ms. Tuff’s demeanor and treatment of the gunman de-escalate his emotional and mental instability, or did the gunman eventually recognize his own insane behavior?
How far should individuals or society allow mental psych patients (on or off their meds) to throw tantrums of highly inappropriate behavior, even violence, to get what they want?
Given that the majority of mental psych patients (and often their families) cannot function perfectly in society or jobs/careers, WHO should foot their treatment bills? Who suffers most when people like this gunman snap?
With these questions I hope to draw attention to America’s increasingly social dysfunctional problem-solving systems and education, as well as how best to address them. Do we keep locking them up? They’ve done that hundreds of times with my sister with little improvement other than temporary band-aids.
Please let me hear your comments, thoughts and feelings. Because one day you may find yourself face-to-face with the same type of gunman. What would you do in Ms. Tuff’s situation?
Push the play button…scroll down…read and view the rest.
Now the reason we’re here
As man and woman
Is to love each other
Take care of each other
When love walks in the room
Everybody stand up
Oh it’s good, good, good
Like Brigitte Bardot
Now look at the people
In the streets, in the bars
We are all of us in the gutter
But some of us are looking at the stars
Look round the room
Life is unkind
We fall but we keep gettin’ up
Over and over and over and over and over and over
Me and you, every night, every day We’ll be together always this way Your eyes are blue like the heavens above Talk to me darlin’ with a message of love
Now the reason we’re here
Every man, every woman
Is to help each other
Stand by each other
When love walks in the room
Everybody stand up
Oh it’s good, good, good
Say I love you, I love you, I love you, I love you, I love you, I love you
Talk to me darlin’
This slideshow requires JavaScript.
Music: Message of Love by The Pretenders
(paragraph break)
(paragraph break)
(paragraph break)
(paragraph break)
(paragraph break)
This was a needed change of pace/post for me…given my previous post. Hope you enjoyed it as much as I enjoyed putting it together, listening, singing, dancing…and remembering how great life can be in the right perspective.
For the last four weeks I’ve been quite busy. During this time I have set to one side the task of blogging; it had to take a lower priority. And as is typical in life there are sometimes distractions or obstacles that get in the way of things we want to do, like blogging. I have had such a week; more like several weeks. Each time I wanted to continue and finish the humorous post I had started and planned for publishing days ago, life would throw a curve ball. Seven out of ten times I am able to easily manage the distractions or setbacks. But as many of you may know, life doesn’t always cooperate with our wishes and plans.
There are two significant factors that every single person alive must address and manage at some point in their life: family and aging elders, or death. The timing of both these factors is almost never convenient nor are they always pleasant when it is a family member. Family has the distinct uncomfortable privilege of reaching too often the deepest parts of our heart and soul. For the last 31-years I have had the “privilege” of witnessing my sister’s chemical-addictions, soon exacerbated with psychological issues, burden my mother and her usually huge warm energetic heart with every passing year – with every single perpetual relapse by my sister every month to three months – take off two, five years of my mom’s health and vitality each time. We have been a three-member family since my father’s suicide in 1990, and guess who is always counted on (by default) for strength, understanding, and eventually some comic relief?
I have to admit…it gets really fucking exhausting.
For the last thirty-plus years I have done a LOT of screaming; screaming at the sky, screaming at the walls, screaming at my dead father wherever he is, and screaming at my three different therapists who’ve had the “privilege” of helping me through the bad times.
But those screaming sessions cannot compare to the decibel levels I’ve screamed (mostly in my head) over and over when I listen to alcohol-drug support groups and leaders talk about “The Disease.”
I have no hesitation in confessing that I am apparently on the outside looking in. There are support groups for family members of chemical-addicts that not only offer emotional support, but also educate family members of addicts (often the issues of enabling and co-dependency) how to manage themselves around an addict’s pathology. What is taught and what is often embraced by these groups, sometimes makes me want to scream with my already strained exhausted vocal cords!
Is it right…is it best to give, to surrender so much power and control to the disease?
If I examine my sister’s 31-plus years of addiction and never-ending relapses, I would wonder. Fuck, who am I kidding? I do wonder…but from a very frustrating “disadvantaged” viewpoint. So I continue to scream, apparently until I have no vocal cords left to scream because apparently this fucking “disease” will never go away. Apparently it can never be cured, only managed until the day she dies.
Is that the way it will always be for the brothers and mothers of addicts? I have to accept it? I really have a serious fucking problem with that white flag! I have always had that problem, which for the last 15-20 years has sometimes caused my already aging, tired compassionate mother perhaps more stress than comfort and hope! And that makes me want to scream more!
When is passiveness or surrender unhealthy?
After three months in counseling soon after my father’s suicide, my therapist, with tears rolling down her cheeks said “You are one of the most remarkable Survivors I have ever counseled.” The four major life events I was forced to deal with in 1990 was blowing her away, let alone her clinical concern for my mental-emotional health. She confessed to me years later that she had considered diagnosing me with major depression with suicidal precautions. Apparently statistics show that immediate family members of suicide victims have an increased likelihood of suicide themselves. I understood all too well that concept play out on 9/11 when watching people jump from the top-floor windows of the World Trade Center towers to their death — sometimes it just seems to be too unbearable. I have felt their pain, but then I scream back at life with my best warrior face.
Laurel Land Cemetery where my Dad is buried & Mom has her plot. She & I have also discussed where to put my 49-yr old sister.
It seems with each passing month and each passing year a survivor-of-suicide has an exponentially greater chance of becoming a uniquely advantaged super-human, or so the clinical data shows. So what does it mean when one is also forced to support an aging 73-year old elderly mother – cut short of ten happier years by a pathological relapsing addict-daughter – who physically and emotionally has either reached or is damn close to her life-limit? How much are we supposed to endure? How much are we obligated to endure my sister’s 31-years of repeated insatiable relapses which are always around the corner ready to devour? How many more damaged exhausted victims have to fall in her wake?
I am one extremely pissed-off brother (again) as I watch my sister – who consciously chose to consume those chemicals as a teenager – inflict again on my undeserving mother, inflict again on her undeserving AA and NA support friends, and inflict again on society as a whole, who with their tax dollars or donations throw away give and give, and give to a disease that can only be partly managed with unpredictable results…always.
This is the way it has to be?
Signed angry, exhausted “Survivor” brother and son who doesn’t feel very super-human!
What is excessiveness? The dictionary defines it this way: exceeding a normal, usual, reasonable, or proper limit. Historians have sometimes defined it as out Herod Herod. Lord Salisbury in Shakespeare’s King John perhaps described it better as painting the lily:
Therefore, to be possess’d with double pomp, To guard a title that was rich before, To gild refined gold, to paint the lily, To throw a perfume on the violet, To smooth the ice, or add another hue Unto the rainbow, or with taper-light To seek the beauteous eye of heaven to garnish, Is wasteful, and ridiculous excess.
Every single human being requires a handful of necessities: water, food, climate-control, and shelter. To what extent or elaboration those four basic needs are fulfilled, can be averaged at any location, and thus a global standard can be determined. One and perhaps a minimum of two of these basic life-needs are in finite supply and crisis on our planet.
Fair warning for those who are sensitive to or bothered by grim facts of nature, our planet, and other human groups, self-discretion should be considered. What follows, in my opinion, needs to be at least made aware and considered by everyone on Earth.
(paragraph break)
* * * * * * * * * *
What do you think would happen if when you turned open your faucet and nothing came out? How long could you survive without water? Now, what do you think would happen if your entire city was without water or operating sewage? What would happen if a nation lost its water and sewage? There is no water to feed crops or gardens; no clean water to drink. Are you getting the picture? If not, let’s hear the alarming projections some scientists, scholars, and professional experts are reporting. Sorry this alarming documentary is an hour-and-a-half long, but it needs to be shared:
If you still feel this is not a problem for you and your children and grandchildren, you should have your ears examined. If you feel resource conservation is a form of socialism or communism, then you are in delusional denial.
Excessive opulence or resource hoarding is no different a global footprint than spending or consuming recklessly; they both accomplish the same singularity: proportionate risk. The more excessive, the more risk; the more risk, the more excessiveness to avoid it. As a species, if not as Americans, we need to…no, we must greatly refine our life-ambitions and the education of those ambitions and their purpose.
But let’s pause a moment and analyze where most Americans have headed since 1870 and are currently heading.
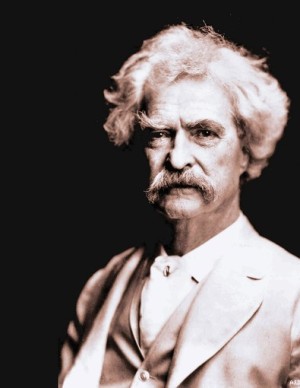
1870 – 1900: The Gilded Age
Mark Twain
Much pride and boasting has been made of America’s age of industrialization, that it was the catalyst that put the nation in the same discussion of the world’s greatest empires. Yet of our nation’s 12-million families then, 11-million earned less than $1,200 per year; of this group the average annual income was $380, well below the poverty line. In today’s CPI dollars (the purchasing power of goods and services produced in the 1890 economy) that is $9,890 per year per household. In his book The Gilded Age: A Tale of Today, Mark Twain wrote of the day’s barons and tycoons, “What is the chief end of man?—to get rich. In what way?—dishonestly if we can; honestly if we must.”
Though pre-1920 U.S. economic reports are less comprehensive as post-1920, Benjamin Schwarz of the World Policy Institute and Executive Editor of World Policy Journal writes in his 1995 New York Times article “By 1890, the richest 12-percent of households owned about 86-percent of the country’s wealth.”
1890 – 1920: Progressive Era
The Roaring Twenties
In 1910 the average annual household income was $574 per year. In today’s CPI dollars that is $14,300 per year per household. During this era America’s top 1-percent owned about 40-50 percent of the nation’s wealth and the top 10-percent fluctuated around 70-percent until President Theodore Roosevelt began his anti-trust legislation and wealth redistribution via progressive taxation.
1920 – 1929: The Roaring Twenties
The average annual household income was $1,407 per year in 1920. In today’s CPI dollars that is $16,100 per year per household. In 1922 America’s top 1-percent owned 37% of the nation’s wealth; a slight change in years following Teddy Roosevelt’s administration. America’s middle-class indeed experienced a relative age of prosperity during the Roaring Twenties due to the automobile industry which fed industries such as oil, road-construction, tourism, manufacturing, and electric-power.
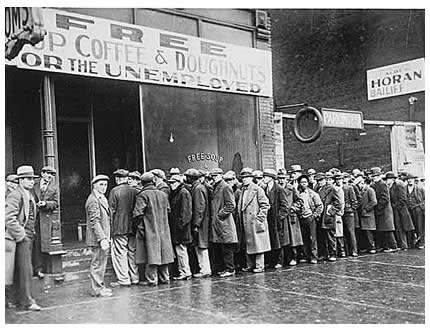
1929 – 1941: The Great Depression
The average annual household income in 1930 was $1,388. By 1940 it had dropped to $1,315. In today’s CPI dollars that is $19,100 and $21,500 per year per household respectively. America’s top 1-percent in 1933 owned 33% of the nation’s wealth and 36.4% in 1939 demonstrated the upper-upper class comfortably rode out the stock market crash of ‘29. Unemployment for the nation’s middle class was at 25% and especially higher in heavy industries such as lumbering and agricultural exports in cotton, wheat, and tobacco. Fortunately, from a purely economic standpoint, another world war was on the horizon ready to put Americans, particularly women, back to work on a road to bigger prosperity than the Roaring Twenties.
1945 – 1973: Postwar Prosperity – The Golden Era
The average annual household income was $3,180 in 1950 ($30,300 in 2012 CPI) and $4,816 in 1960 ($37,300 in 2012 CPI), a significant increase in just 10-years. Middle-class Americans also enjoyed a bigger piece of the nation’s wealth: 70.2% in 1945 and 73% in 1949 while America’s top 1-percent saw their portion drop again to 29.8% and 27% respectively. Yet, it is this Golden Era that firmly placed the United States as a world power and dominant economy. As more and more Americans gained more wealth and more income, the nation experienced its most prolific prosperity to-date. How it happened will be examined shortly.
The American Dream. Notice the ethnicity?
When Dwight Eisenhower took office (1953-1961) the nation was going through another recession post-Korean War causing a decline in the nation’s GDP. This resulted in middle-America having less of the nation’s wealth over a 16-year period down to 65%, while America’s top 1-percent relished in increases back up to 34.4% of the nation’s total wealth in 1965.
By 1970 the average annual household income was $7,494 or about $44,300 in today’s CPI dollars; another notable increase in 10-years. As the Golden Era drew to a close and the Cold War and Vietnam festered, President Lyndon Johnson’s Great Society programs increased lower and middle-America’s wealth to 71% while America’s top 1-percent saw theirs fall to 29% of the nation’s wealth. However, hard times were just around the corner for most Americans.
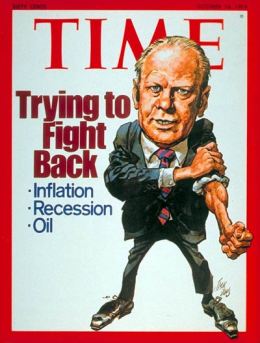
1970 – 1976: Age of Stagflation
Image Time Warner
In 1973 the average annual household income was $9,037 or approximately $46,700 per household in today’s CPI dollars. The nineteen-seventies became known economically as the Age of Stagflation. The 25-year U.S. economic growth post-WW2 had stagnated to a crawl, and prices in goods and services rose annually in the double-digits from 10% in 1973 to 18% in 1979. Due to poor performances on Wall Street, America’s top 1-percent saw their share of the nation’s wealth drop to the lowest in history: 19.9%. Yet, middle-America enjoyed the highest ever share of the country’s wealth at 80%.
The eras of suburbanization in the 50’s and 60’s, however, had significant consequences in the 70’s. The migration of tens of millions of middle-Americans (most of them White), moving to newly developing suburban towns meant getting to work in cities went from public transit to private vehicles. This in turn caused America to become heavily dependent on foreign oil. The long-term varied ripple effect of suburbanization cannot be overemphasized, one of which is our bigger footprint on environmental and global issues.
1976 – 1992: Gilded Age Returns and Reaganomics
Reagan addresses Congress 1981 (Wikipedia)
From 1976 to 1988 the average annual household income was $11,080 or about $44,700 in 2012 CPI dollars – yes, a $2,000 drop from the previous 3-years – to $25,167 or about $48,800 in 2012 CPI dollars; just above break-even from 1976. To combat the stagflation of the 70’s, government deregulation along with personal and business tax cuts gained popularity. As it turned out most of the tax breaks, along with deregulating helped America’s upper-classes.
Additionally, defeats of labor unions – unions made possible by Teddy Roosevelt reforms with long histories of keeping big-businesses from corruption and abuse of workers – also fattened the pockets of America’s top 1-percent by going from 19.9% ownership of the nation’s wealth to having 35.7% by 1989. By 1992 the AAHI (average annual household income) was $28,870 or about $47,200 in 2012 CPI dollars; another drop from 1988. While middle-America struggled, the top 1-percent in America owned a rising 37.2% of the nation’s total wealth.
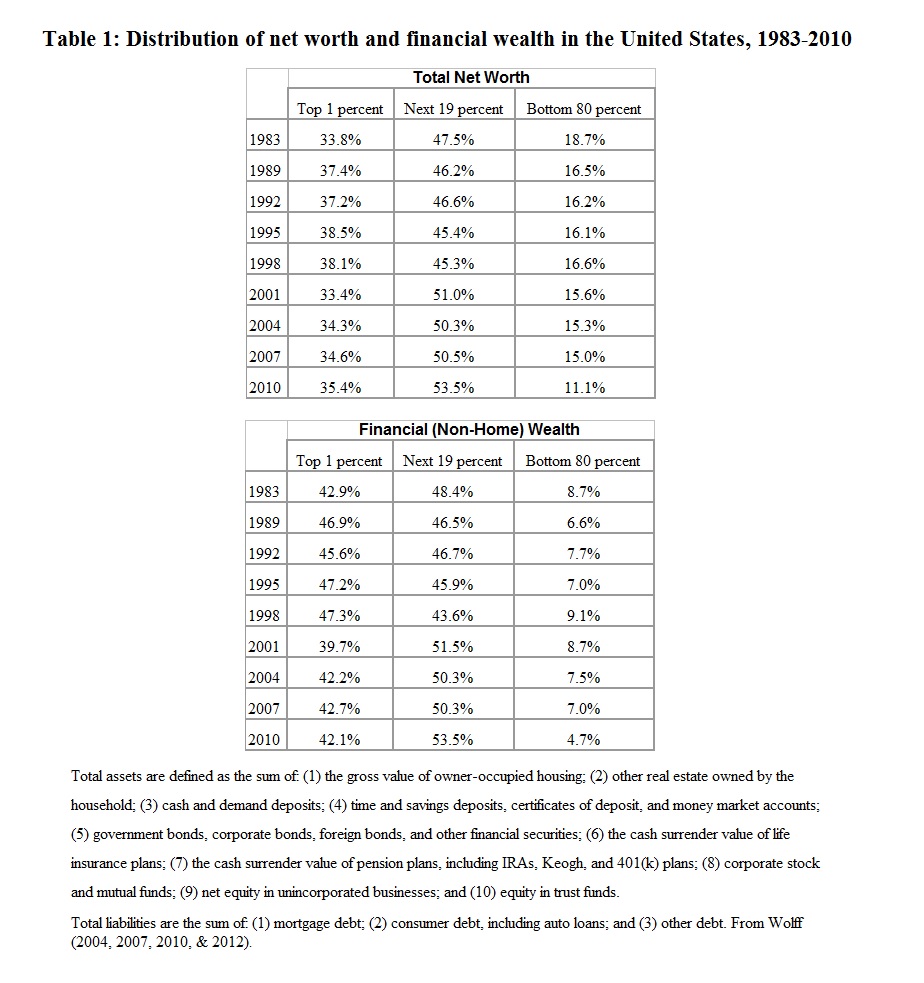
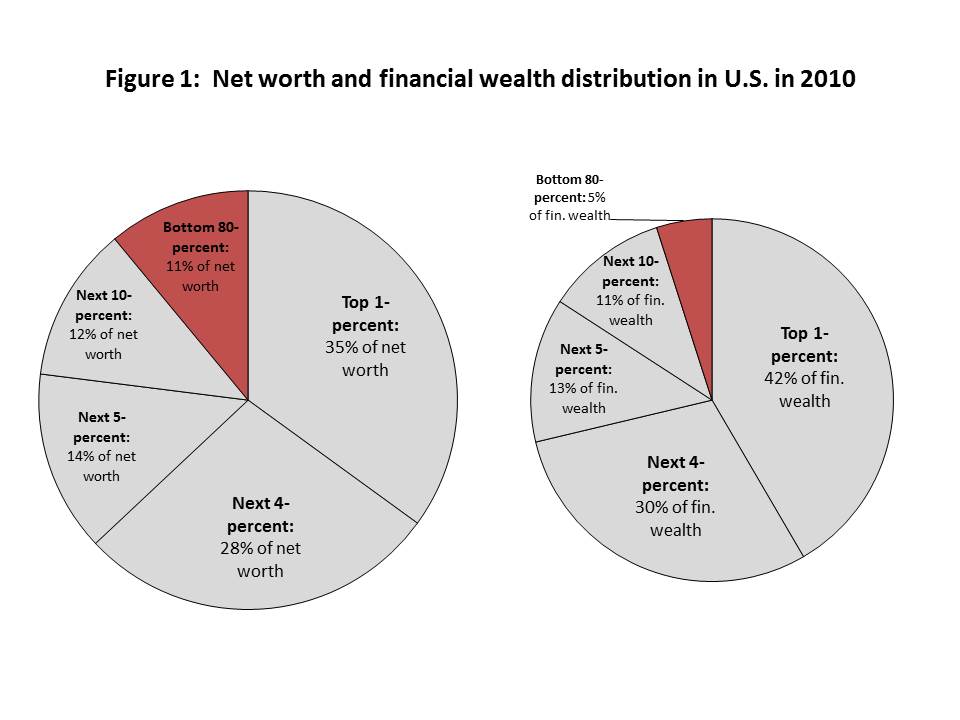
Beginning in 1983 economist Edward Wolff has tracked America’s net wealth and financial (non-home) wealth distributions. As Table 1 above and Figure1 below show, it is an increasingly bleak outlook for the majority of Americans.
Click image for larger view
1990 – Present: Globalization and World Superpower
The 1990’s will be compared to the prosperity of the 1920’s and the 1960’s. But as a whole is that what the data reveals? The AAHI was $32,558 in 1995 or about $49,000 in 2012 CPI dollars and America’s top 1-percent enjoyed another increase in the owned wealth of the nation at 38.5%. For six brief years (1994-2000) the economy saw rises in the national debt, the stock market, and the GDP while inflation plateaued and unemployment dropped below 5% because of the Dot-com Boom. Economist and civilians alike agree that the growth explosion was mostly a result of workplace computerization. But the good times would come to an end in 2001.
Map of the world wide web 1990-2000
A constant influx of immigrants seeking the American Dream, an American economy becoming one of the major players in a growing global economy, a false sense of security in the housing market, and numerous corporate scandals in the energy and finance sectors due to previous government deregulating, all contributed to the tipping-point by 2007. The AAHI in 2000 was at $40,418 or $53,900 in 2012 CPI dollars and the top 1-percent in America saw their portion in the nation’s wealth drop to 33.4% due to a sharp declining stock market worsened by the attacks of 9/11. There is another set of globalization dynamics that added to the plight of middle-America.
With the exodus of American jobs like cheaper electronics, fashion, shoes, and toys moving to developing nations, middle-Americans watched as their job and salary-leveraging also weakened with fewer lateral or upper employment positions. Then jobs in TV, auto, steel, and home-furnishing manufacturing followed. With those positions gone abroad, the American job-market went from high-paying management positions to simple service-industry low-paying positions which certainly need no college degree. This move marked the boom of trade-school certifications for a growing electronic blue-collar job-market.
Why Mexico is becoming a global manufacturing power – Bloomberg Businessweek article
The domino-effect of American digitization, the snowballing Internet, and high-speed networks spreading to all corners of the globe have combined to gorge the growing socio-economic gap wider and deeper. In 2007 the AAHI was $48,332 ($53,500 in 2012 CPI dollars) eaten-up by inflation and the cost-of-living. Meanwhile, the top 1-percent owned a steady 34.6% of the nation’s wealth. The lap of luxury doesn’t stop there. With the creation of a connected more global economy today, along with new multiple global opportunities and substantially lower-wages to foreign workers, it should come as no surprise what sector of the American population currently enjoys the fruits-of-foreign-labor.
The World’s 200 Richest People(s):
The most industrialized developed countries in the world by population-size are in Europe according to the 2013 United Nations Human Development Report. Of the top 10 nations with the highest Human Development Index (HDI), six of them are in Europe (see Report). One might infer from that list then that many of the world’s wealthiest people reside in those countries or at least in Europe. You would be wrong.
Of the 200 richest people in the world as of 2012, 61 of them (or 31%) are citizens of the United States. What is perhaps unexpected is where the second richest group of people call home. Of the next 139, 20 of them (or 10%) are Russian, ironically a former part of the old communist U.S.S.R. The next 26 richest people come from Germany (13) and Brazil (13) at 7% and 6.5% respectively. To see the world’s wealth and what portion of it is owned by the wealthiest 200, see the pie-chart below. For the most current world ranking of the world’s wealthiest as ranked by Bloomberg click here.
As the largest population of one of the most modern industrialized nations – currently 314 million and growing – the United States has the largest percentage of the population with the smallest percentage of the nation’s wealth. Since 1983, as seen in Wolff’s two Tables above, it has decreased every single year. To put this disparity succinctly, in terms of financial eggs-in-a-basket the top 1-percent own 35% of all privately held stock, 62.4% of all business equity, and 64.4% of financial securities in America. Is it any wonder why middle-American taxpayers were held for ransom in 2008 to bailout our own mega-banks and financial firms, mega-auto companies, and integral government-sponsored entities? The top 1 and 10-percent held the nation by the balls. Sit down, it get’s more alarming.
The top 10-percent own 81% to 94% of all American bonds, trust funds, stocks, and business equity, and nearly 80% of all commercial real estate. The real value of financial wealth is determined by control of income-producing assets; assets that can absorb recessions or devastating irreparable depressions. Therefore, it is reasonable to conclude that 10% of Americans own the United States. Talk about utter investment stupidity in placing the nation’s “eggs” in one or two baskets! There is no way to sugar-coat it. Perhaps Abraham Lincoln’s Gettysburg Address should be rewritten to reflect today’s socio-economic times: “Government of the 10-percent, by the 10-percent, for the 10-percent.”
Land of the Few, Home of the Lavish
Listed at $190-million, Copper Beech Farm in Greenwich, Connecticut is the most expensive home in America. Built in 1896 and previously owned by the Greenway family of U.S. Steel with Andrew Carnegie as well as timber tycoon John Rudey, it has over 13,000 square feet on 50 waterfront acres with spectacular views of Long Island Sound. As a French Renaissance style home with 12 bedrooms, wine cellar, a 75-foot outdoor pool, a grass tennis court, a large formal arboretum, two greenhouses, and private apple orchard, accessible by a 1,800-foot private driveway. Oh, and the property includes two offshore islands.
Copper Beech – Greenwich, CT
Copper Beech Farm is simply one home of over 100 homes priced above $10-million. From 2005 through 2012 Greenwich, CT has been ranked as the best wealthiest place to live in the U.S., the “Biggest Earner” per household in the U.S., and #1 wealthiest residents per capita in the nation. Many of the residents are Wall Street hedge fund managers, writes Nina Munk of Vanity Faire Magazine, and “of the $1.2 trillion currently invested worldwide, approximately one-tenth, or $120-billion, is now managed out of Greenwich alone, according to Hedge Fund Research, Inc.” Munk also reports that four of the richest 400 Americans live in Greenwich and three of those are hedge fund managers. One Greenwich real-estate broker reported these four residents will drop five to eight-million dollars without a second thought. Some even a lot more.
“Almost As Big as the Taj Mahal – To judge by the number of swollen, over ambitious mansions rising from lots in Greenwich these days, you’d almost think we were back in the 1910’s and 20’s – except that this time round the lots are small, and the houses are almost on top of one another. “Years ago, wealthy houses were hidden in the rear of properties after long driveways…and no one ever built to the maximum allowable square footage,” remarked Diane Fox, long time director of Greenwich’s Planning and Zoning Department, in an e-mail to me. “Today all big houses want to be seen from the road.””
Munk’s article of Greenwich’s rich and lavish also mentions that one interior designer installed broadloom carpet at $74,000 for one bedroom, and drapes and curtains at $20,000 to $25,000 for one bedroom. You read it right, one bedroom.
Why is this level of wealth and excessive opulence worth mentioning?
Because today American legislation, political campaigns, and economic policies resemble little of what they did six decades ago. In 2010 the U.S. Supreme Court allowed American corporations, including those owned by the top 1 and 10-percent of the nation, the opportunity of donating vast financial resources for political candidates and their election campaigns; “resources” with millions of dollars beyond what any individual voters could organize. Remember, 80 to 90 percent of Americans hold or own just 4.7% of the nation’s financial wealth. The political phrase in the 1940’s and 50’s “one person, one vote” means today “one dollar, one vote.” That 2010 decision sets the stage for a class of super-wealthy political campaigners to push (as if a majority of individual voters) their one-dimensional political-economic interests: enhancing their profits and revenues.
A Communal America is Imperative
This four-part series has not been about political, economic, or social envy. It seems the bottom 99% or 90% are for the most part not jealous of America’s gazillionaires or their social contributions and hard-earned incomes. What this four-part series has been about though is political fairness, representation, and efficiency. As discussed in part two Productive Inequality, rent-seeking moves wages and wealth from the bottom and middle classes to the top 10 and 1-percent while distorting the “free market” in favor of some and to the detriment of most. More “efficient” policies of the market matter for a more equitable distribution of national wealth. Improper policies (e.g. of the last 32-years) lead to a less efficient economy and a growing divide between socio-economic classes.
Strength in lots of Einsteins!
It is a fairly simple overall concept. When our society is sufficiently (even abundantly) funded in infrastructure, education, research, and technology, these vital areas of a thriving economy offer hope and security to ordinary citizens. The majority of Americans, the bottom 90%, will actually SEE and experience for themselves what the U.S. Constitution, the Statue of Liberty, and all other symbols of democracy, equality and fairness are really made of… not just “promised” or rhetorically talked about on TV. Those principles would be available to a vast number in society in an efficient dynamic economy. Even the top 1-percent would benefit when the capabilities of so many quality workers and citizens are not wasted but fully utilized. It’s a concept of not just strength in numbers, but strength in well-educated, ingenious, motivated Einstein numbers! There is a huge difference between the two. The difference is not just inclusive, but very alien to exclusive.
In his superb book The Price of Inequality: How Today’s Divided Society Endangers Our Future, Nobel Prize winner in economics Joseph Stiglitz gives a superbly educated agenda on exactly how American government and her 314-million citizens can avoid falling into the same death-trap history’s great empires and their leaders fell into. If you would like to read an outline of his proposed extensive agenda, click here.
My own meek semi-educated ideas of how not to follow, for instance, the Roman Empire’s demise or the former Soviet Union’s, or the more recent countries of Egypt, Tunisia, and Syria… are this:
What is the reading on your/our Collective-Goodness-Gauge? What is the health of your/our common welfare, our passion for civic responsibility and the well-being of the persons near us?
These are NOT just social questions! More importantly they are political and economic questions too. As the French political philosopher Alexis de Tocqueville noticed about the nature of American society in 1835, freedom (or individualism) can be a tricky balancing act within democracy. Some “individualized” Americans independent of a majority often have the pragmatic realization that looking after the welfare of others is not only good for the soul, but is equally good for business and wealth. Stiglitz elaborates on this truth wonderfully:
“The top 1 percent have the best houses, the best educations, the best doctors, and the best lifestyles, but there is one thing that money doesn’t seem to have bought: an understanding that their fate is bound up with how the other 99 percent live. Throughout history, this has been something that the top 1 percent eventually do learn. Often, however, they learn it too late.”
…no matter class or status
The Roman Empire, Egypt, Tunisia, and Syria are just four examples to what Stiglitz refers. The former Soviet Union is an example of no individualism when no single “part” is allowed to reach its full brilliance and potential for the benefit of the whole; the other extreme. Both ends of the economic-socio-political spectrum REQUIRE resource investments and management from every single citizen. The stable “middle” if you will, has a steady balanced, efficient, fair, and equal flow of civic investment. Any one mechanism cannot efficiently coexist without the other efficient mechanisms. So…
If the United States wishes to return as one of the best symbols of freedom, liberty, democracy, and equality for all, then reaching that efficient balanced middle is an imperative collaborative, collective return to a well-managed, well-governed, wealth-balanced cause.
I have zero expectation that anything I ever say will end someone’s belief in their God. Not my goal or purpose. That alone belongs to the individual. ~ Zoe
'Light thinks it travels faster than anything but it is wrong. No matter how fast light travels, it finds the darkness has always got there first, and is waiting for it' - Terry Pratchett


